LiDAR Hunting Maps: See the Terrain Topo Hides
Published July 13, 2026 | huntNotes
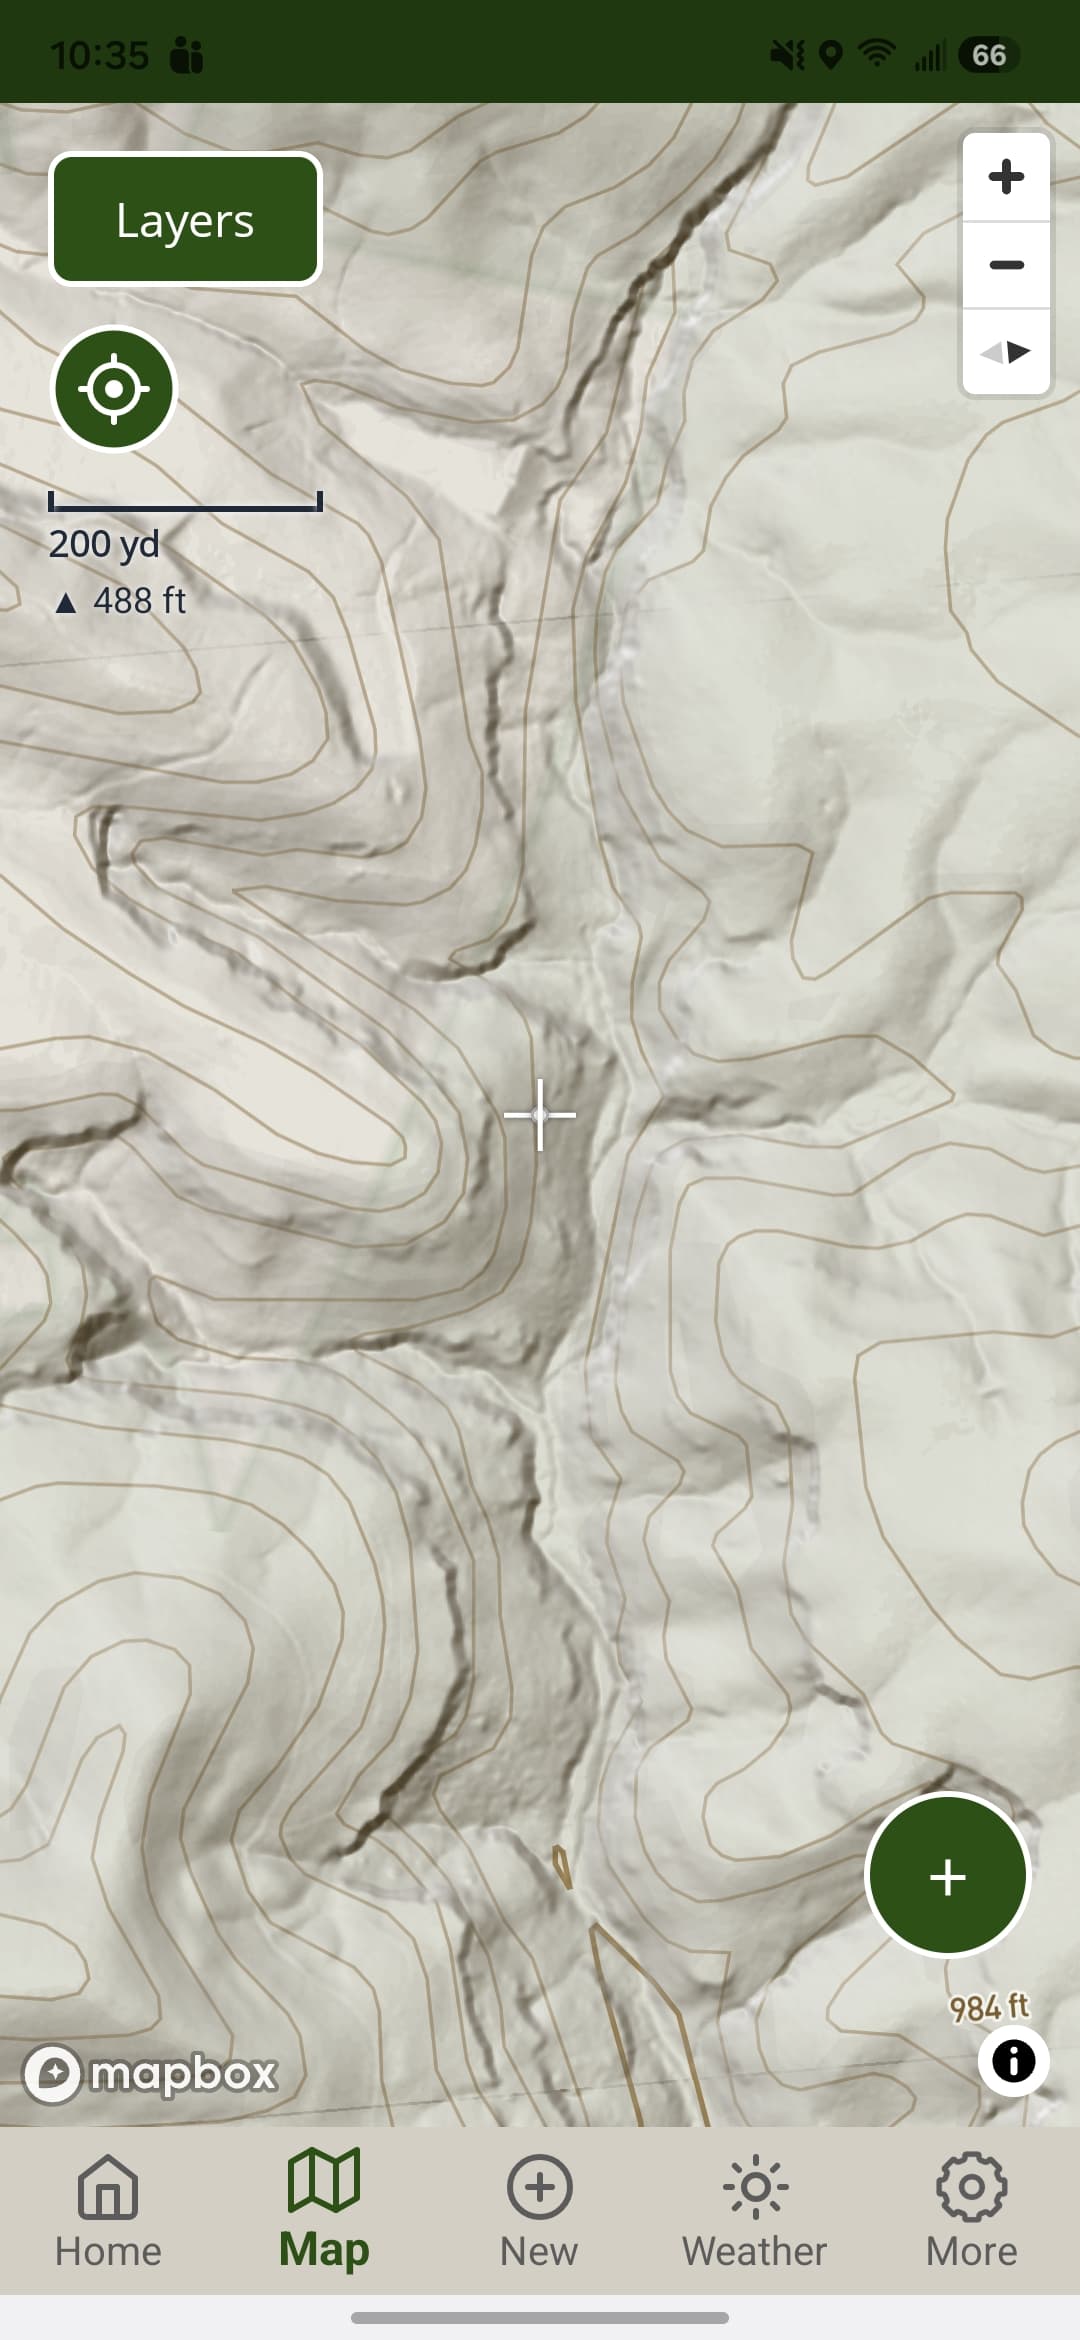
Turn on a terrain layer built from bare earth data and the map stops looking flat. Ridges that read as clean spines on topo break apart into fingers and shelves. Drainages you never noticed show up tight and huntable. Benches cut across hillsides right where deer have been walking for years without you knowing it.
The ground has always been there. You just couldn't see it.
From the Sky to the Screen
Lidar stands for light detection and ranging. A sensor mounted to an aircraft pulses laser light toward the ground millions of times per flight. Those pulses return at different speeds depending on what they hit. The tops of tree canopies. Mid-canopy branches. Understory vegetation. And finally, the actual ground surface. Every return gets recorded with a precise elevation value. The result is a dense three-dimensional point cloud, millions of individual elevation measurements blanketing the landscape.
That raw point cloud is the source. What happens next is where the processing determines everything.
The first model generated from that point cloud is called a digital surface model, or DSM. It represents the elevation of everything the sensor detected, including the full canopy, any structures, and all the surface clutter sitting above the actual ground. A DSM is accurate. It just isn't showing you the ground.
To get to the ground, processors classify each return by type and filter out everything above it. Only the lowest confirmed returns, the ones that actually struck earth, get kept. Those ground points get interpolated into a continuous surface called a digital terrain model, or DTM. The canopy is mathematically stripped away. What remains is a bare earth representation of the terrain beneath the forest, the actual shape of the ground independent of whatever is growing on top of it.
From the DTM, a digital elevation model, or DEM, gets generated for rendering and delivery. The DEM is the visual product. It is what gets served as a map overlay and what you interact with on screen. When a mapping app references lidar, what they mean is that the DEM traces its origin back to a lidar collection flight. Lidar is the collection method. The DSM is the raw surface capture. The DTM is the bare earth extraction. The DEM is what the end user sees.
What gets rendered on top of that DEM is typically a hillshade, a technique that simulates the way light and shadow fall across a surface to produce the appearance of three-dimensional terrain. Hillshade derived from a properly processed bare earth DTM preserves the subtle features that matter for scouting. A DEM derived from an insufficiently filtered DSM carries that canopy noise forward, smoothing and averaging the terrain in ways that erase the micro features. Both can look similar on screen. The difference lives entirely in the processing chain behind them.
The Features That Move Deer and Why You're Missing Them
When you're working from a clean bare earth DEM, the terrain reads differently. Features that a standard topo map smooths over at ten or twenty foot contour intervals suddenly appear. You're looking at sub-meter resolution in many cases, contour lines representing changes of a foot or two rather than ten.
That resolution is where deer movement lives.
The saddles you already know, the obvious ones on the main ridge between two peaks, show up on any map. What a properly processed bare earth DEM reveals are the secondary saddles, the micro-depressions connecting finger ridges, the subtle shelf on an otherwise featureless hillside where a deer can move without skylining itself. These are features that don't exist on printed topo and barely register on standard elevation layers. They show up clean on a bare earth DEM and they hold deer in ways that make you wonder how many seasons you walked past them.
Inside corners. Where a ridge curves inward and creates a natural funnel between two drainages. Deer moving parallel to a contour will get pinched at these corners every time. On standard topo they read as a vague curve. On a clean DEM the funnel is unmistakable.
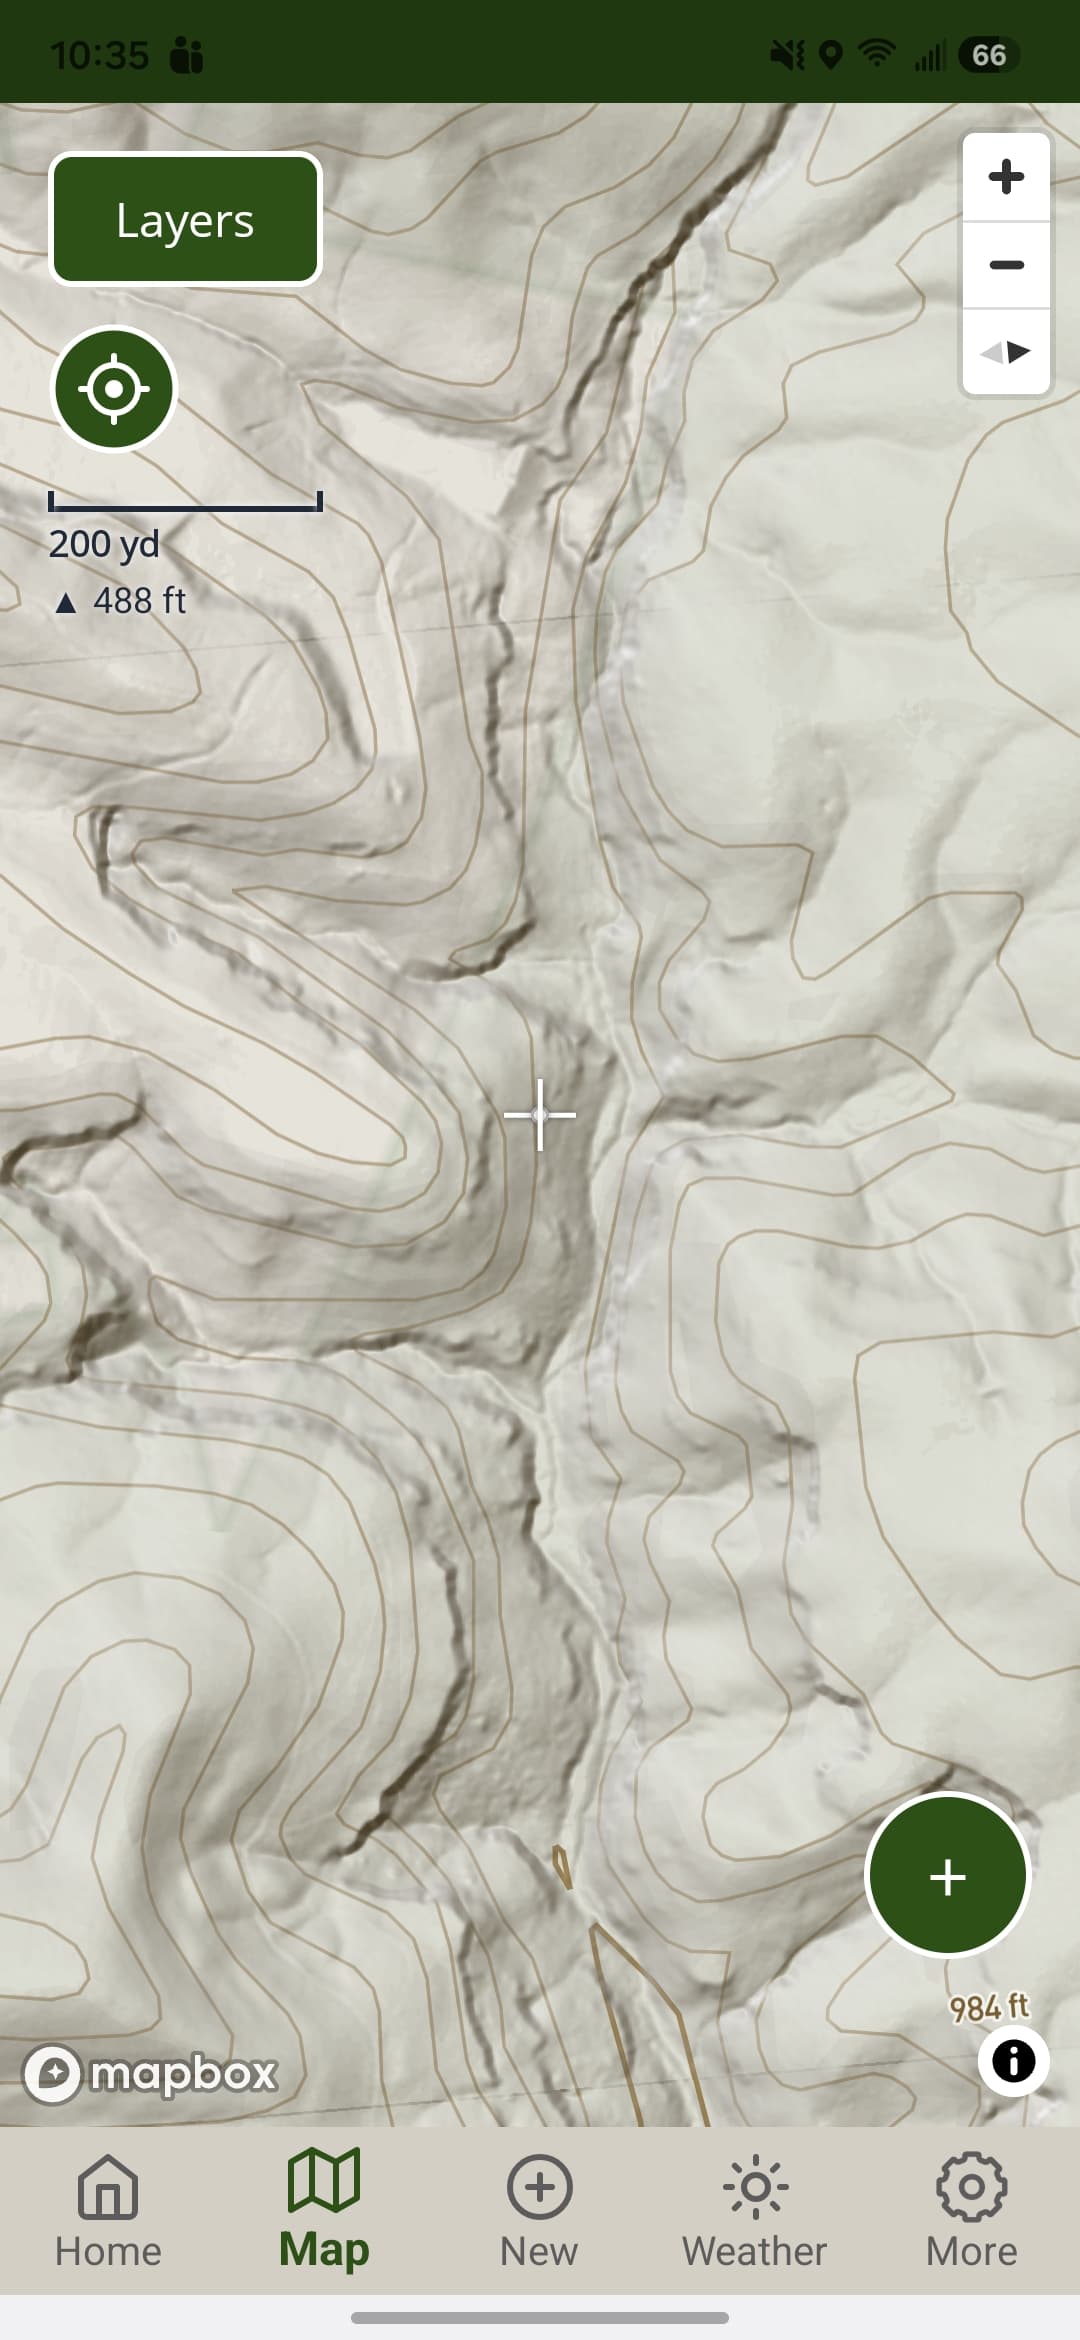
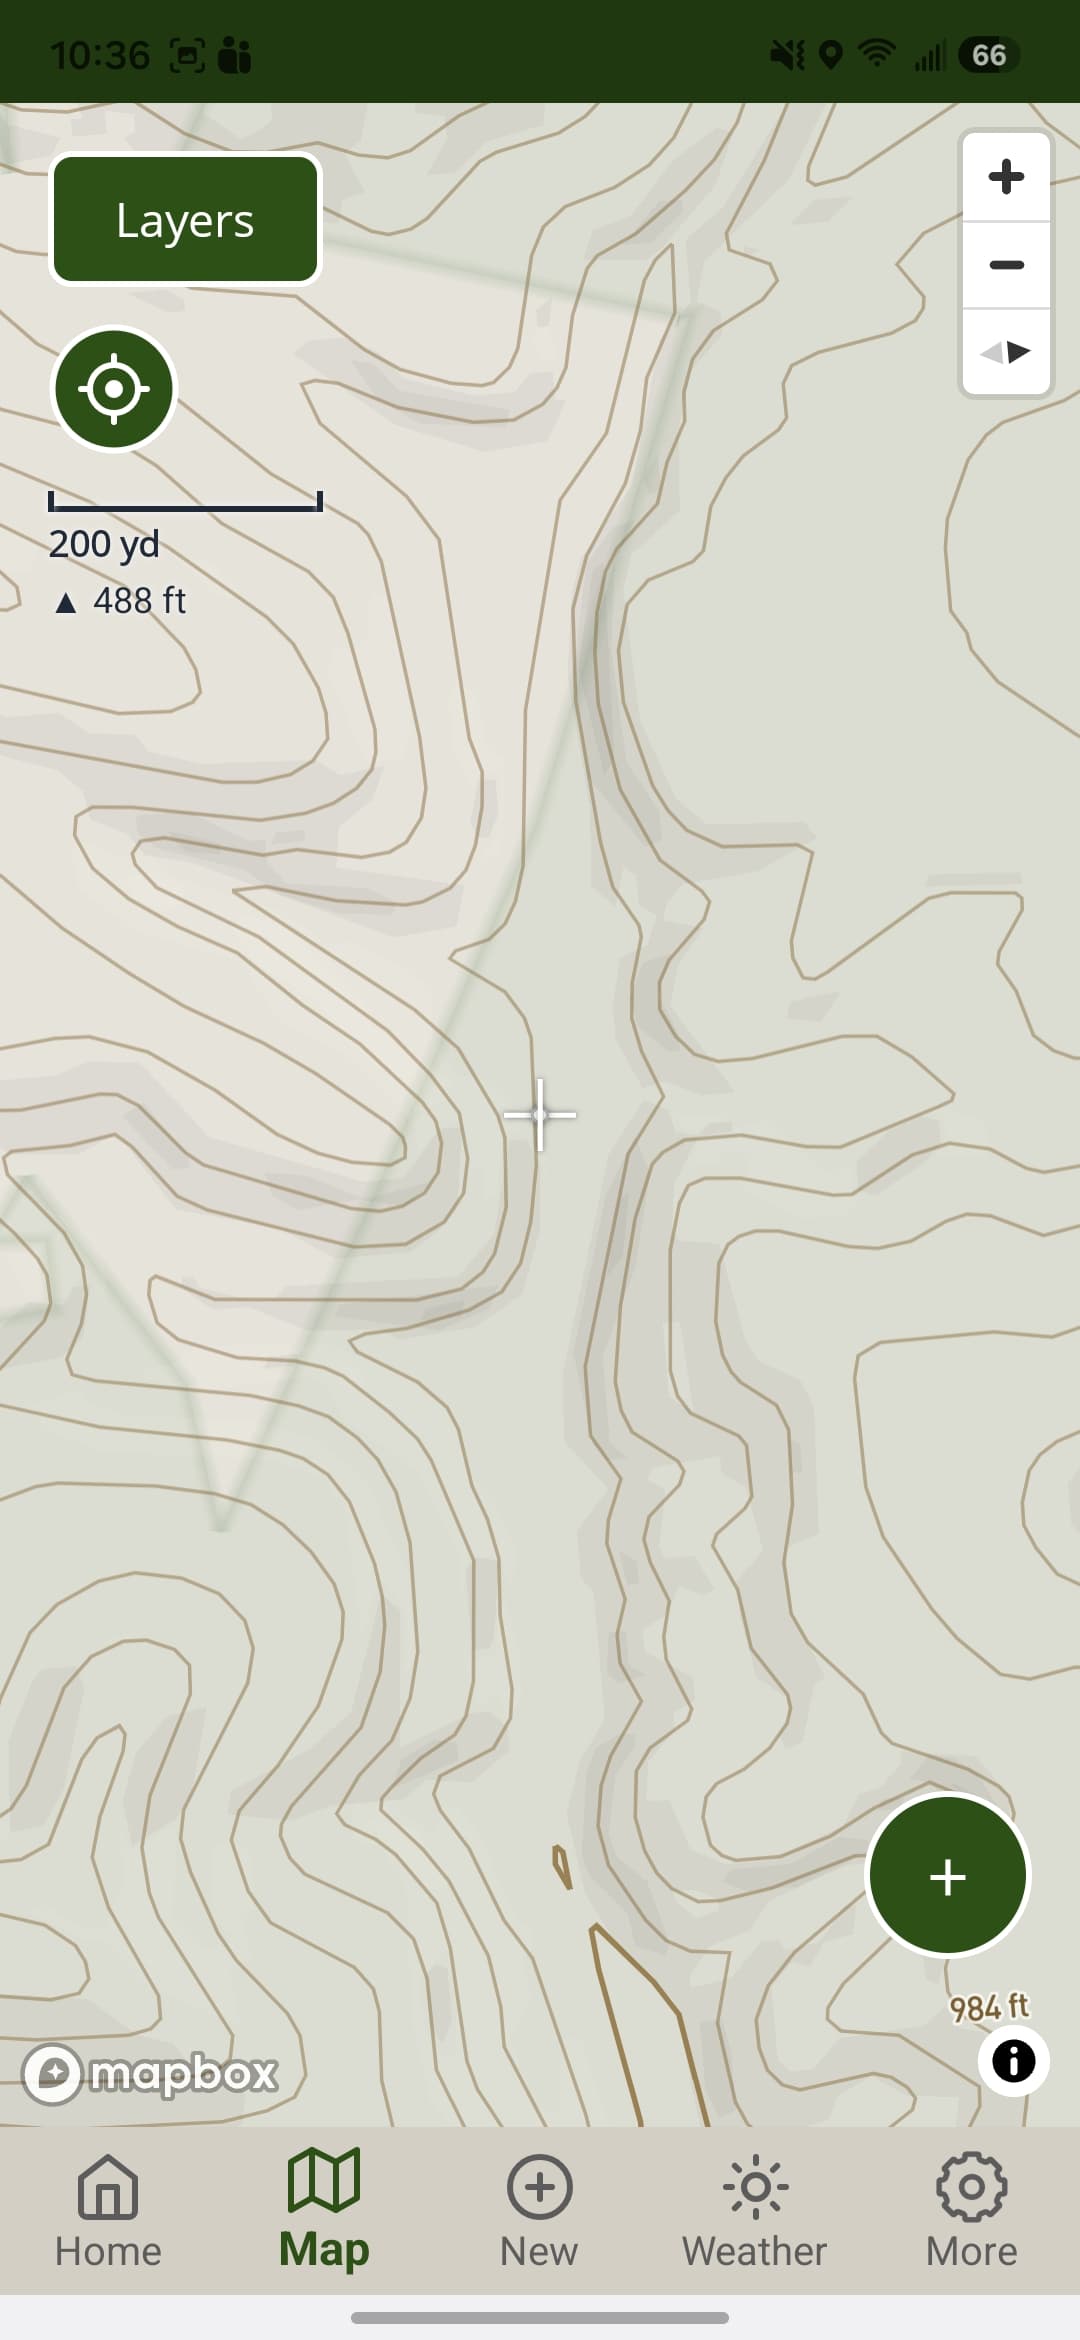
Same ridge, LiDAR on vs off. Drag the handle to compare. Arrow keys work too.
Benches. Flat shelves cut into a hillside, sometimes only a few yards wide. Deer use them as travel lanes, especially below a crest where they can move without exposing themselves on the skyline. On standard topo they often disappear entirely. On a clean bare earth DEM they are obvious, and the ones nobody else is hunting are the ones you find first.
Subtle fingers. Small ridgelines extending off a main spine, often only a few feet of elevation change over a long distance. They don't register as significant features on most maps. Deer use them as approach routes to bedding and as escape corridors when pressure hits. Find them on a DEM before the season and you stop walking past them in the dark.
Creek pinch points. Where a drainage narrows and the terrain forces movement through a defined gap. You can find these by eye in the field but finding them on a DEM first means you can be set up and waiting rather than stumbling onto them mid-season.

Mark the Terrain. Hunt It Later.
Drop a waypoint on every bench, saddle, and inside corner you find. huntNotes keeps your scouting intel offline and ready when the season opens.
This Is the Work That Fills Tags
The hunters who consistently find new ground, who walk into a ridge they've never set foot on and put a stand in exactly the right tree the first time, are not lucky. They did this work before the season.
When the pressure is off and the woods are open, every ground-truth trip has a purpose if you're working from accurate terrain data first. You're not exploring. You're confirming.
Pull the DEM overlay on a piece of public ground you've been meaning to hunt. Or run it on ground you've hunted for years and think you know. Note the inside corners. Mark the benches. Follow the fingers down to where they meet the drainages. Then go walk it. What you find on the ground is going to match what you saw on the screen in ways that standard topo never prepared you for.
That's the shift. From hunting the terrain you assume is there to hunting the terrain that's actually there.
The LiDAR Layer, Live in huntNotes
The maps layer in huntNotes has always been a utility. Offline topo, satellite, the tools you need when connectivity is gone. That foundation is solid. The LiDAR terrain layer is what changes how you use it before you ever leave the truck, and it's live right now on Premium.
The layer is built on open, high-resolution bare earth elevation data from the USGS 3D Elevation Program, the same government LiDAR that feeds the GIS and remote sensing community. No API keys. No paywalled data repackaged under a different label. Every bit of relief you see traces back to public USGS 3DEP, so we can tell you exactly what you're looking at and exactly where it came from.
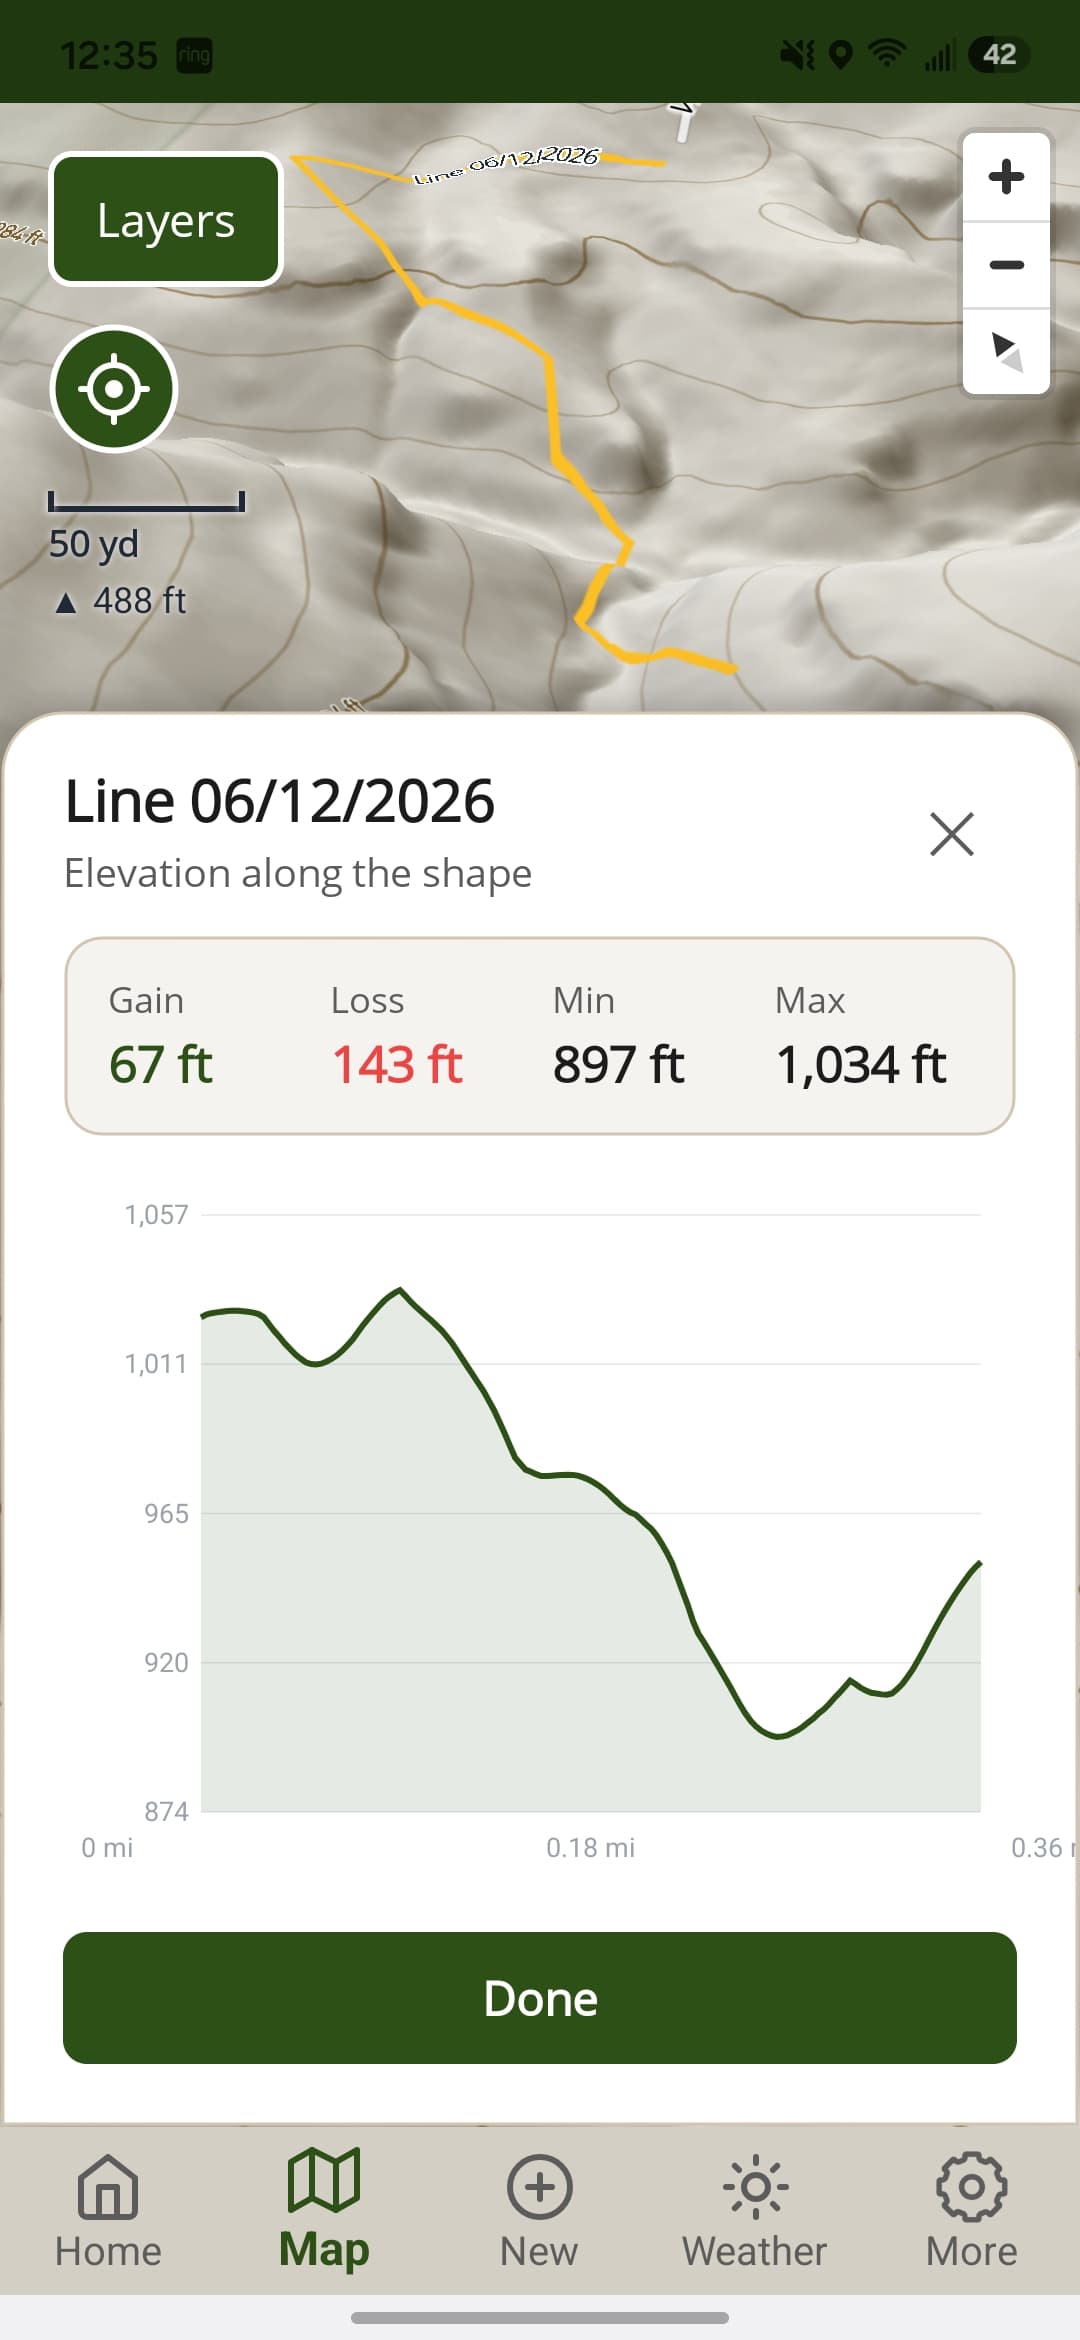
The layer renders as a hillshade relief overlay in 2D and as true 3D terrain. Work a ridge analytically from overhead before a hunt, or tilt into 3D and see how it and its drainages actually sit in space. Drop a line across a face and read its elevation profile foot by foot. And because the tiles cache on device, the layer works the way every feature in huntNotes works: with or without a signal, in a hollow with no bars, a mile from the truck on public ground where nobody else bothered to go.
It's here. Turn it on and start reading the ground you thought you already knew.

Log Every Hunt. Read Every Ridge.
Log waypoints, journal your sits, and scout offline anywhere. Free to download on iOS and Android, with the high-resolution LiDAR terrain layer on Premium.
Free to download. Premium starts at $4.99/month.